Screeps #17: Reports and Metrics
The article below describes the AI in its current state: I’m still expanding and refining my codebase. Here’s the GitHub repo if you’d like to follow along.
Yet Another Diversion
It may seem like we’re getting carried away doing things that have no real bearing on making a winning Screeps AI. This is partly true. But there’s a specific problem I want to solve, and I’m relying on these tools to help.
Our logistics network appears to be inefficient at distributing energy, causing spawn bottlenecks. The spawn and extensions take a long time to fill up. Meanwhile, our logic is panicking that we do not have enough carriers to fill requests, and trying to spawn a lot.
I have a couple changes in mind that may resolve the issue. First is separating the roles for long-range Carriers (for drop/container/remote mining) and Distributors (for filling extensions/towers/etc.). Second is generating hardwired routes rather than taking logistics requests dynamically. To assess the impact of these changes, I want to collect some data.
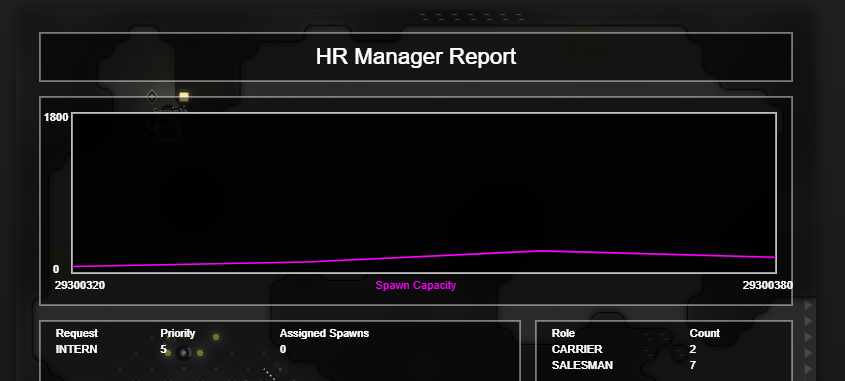
Reports and Metrics
I had previously implemented some Grafana dashboards to display metrics on my energy pipeline, among other things. Unfortunately, in the course of moving to a new and better computer, I did not back up my dashboards and my hard work was lost.
Grafana has advantages for long-term storage. But we’re also tracking these metrics internally, for a certain number of ticks, in order to drive decisions. So, let’s make a few modifications and recreate these reports - inside Screeps.
We already have some components drafted, using RoomVisuals to draw simple tables and bars. But I’d like to split these widgets out into a separate library, both to keep them organized and to let others put these components to good use.
screeps-viz
The screeps-viz repo is up on GitHub and the package is available for install through npm.
The library has a few main components: the main Dashboard, an assortment of Widgets, and some helpful Metrics calculations to organize data for the widgets.
Dashboard
The Dashboard is a container for widgets. When invoked, it returns a render function that will render each widget in its defined location:
const dashboard = Dashboard({
    room: this.office.name,
    widgets: [
        {
            pos: { x: 1, y: 1 },
            width: 47,
            height: 2,
            widget: Rectangle(Label(() => 'Facilities Manager Report'))
        },
        {
            pos: { x: 32, y: 11 },
            width: 5,
            height: 10,
            widget: Rectangle(this.idleMinionsTable)
        },
        {
            pos: { x: 1, y: 5 },
            width: 30,
            height: 30,
            widget: Rectangle(this.requestsTable)
        },
    ]
})
The room option lets you configure a room in which to render the dashboard - if empty, it will render on all rooms. The widgets option is a list of widgets, with position, width, and height. The widgets will automatically expand to fill the entire defined space.
Widgets
The current library of widgets includes:
- Rectangle: A simple rectangle with 1 unit of padding, acts as a container/background for other widgets.
- Grid: Organizes widgets into a simple
nxngrid, separated by one unit of gutter spacing. - Label: Text, with mostly the same styling options as RoomVisual.text(). Tries to center vertically in the widget, but works best if font size is defined as a number rather than a font string.
- Table: A table with an optional label and a header row. Scales columns proportionally to fill the widget based on content.
- Bar: A meter that displays a value versus its max.
- LineChart: A simple line chart, intended to display a timeseries (see metrics).
These widgets generally take two arguments: a data function, invoked each tick, which returns the current data for the widget; and a config object, with properties specific to the widget. Most widgets will include a style prop in their config, which generally corresponds to the RoomVisual styling you’d expect for the element.
The widget function actually returns another function, which the Dashboard calls to render the widget. You can save this defined widget and pass it to multiple dashboards:
const title = Rectangle(Label(() => 'Facilities Manager Report'))

const dashboard = Dashboard({
    pos: { x: 1, y: 1 },
    width: 47,
    height: 2,
    widget: title
})
Metrics
I had some metrics code built already, and I pulled it into this library. I wanted to make sure the metrics data format would be easy to translate for, e.g., a LineChart. You don’t have to use the built-in metrics, but you may find them useful.
The basic metric type is a Timeseries, which is essentially an array of tuples [time, value]. There are a handful of functions that operate on a Timeseries:, returning the min, max, and average, or trimming the timeseries with head or tail for condensed reports.
- max(series): Returns max as
[time, value] - min(series): Returns min as
[time, value] - sum(series): Returns sum of values
- avg(series): Returns average of values
- head(series, count): Returns a truncated Timeseries with just the first
countentries - tail(series, count): Returns a truncated Timeseries with just the last
countentries - granularity(series, ticks): Returns a reduced Timeseries where values are “binned” (averaged for every
nticks)
A new value can be added to the timeseries with the update function. Because we have limited resources in Screeps, the update function has an optional limit parameter, keeping only the newest limit entries.
const metric = newTimeseries();

// Can provide the value, implying time is current Game.time:
update(metric, 10)
// Can provide the time and value:
update(metric, [123, 10])
// Can provide a limit, to keep no more than the limit:
update(metric, 10, 100)

// Can get statistics:
max(metric)
min(metric)
avg(metric)
Although not optimized for serialization, a Timeseries is a “plain object,” so it may be written to and loaded from Memory if desired. I haven’t found a need for this yet, but I expect it can be compressed significantly using techniques like screeps-packrat.
In addition to the basic timeseries, there is a DeltaTimeseries. Instead of recording the value itself, it records how much the value has changed. This is useful to track the rate at which the Controller is being upgraded, for example:
const metric = newTimeseries();

updateDelta(metric, room.controller.progress, 100)
If you want to track the rate at which your Sources are being depleted, you’ll see a huge spike each time they get refilled. To prevent this, you can use updateNonNegativeDelta, which (just as it sounds) will ignore negative changes:
const metric = newTimeseries();

updateNonNegativeDelta(metric, -source.energy, 100)
(Note that we convert source.energy to a negative number, so when the available amount decreases, the delta is actually positive!)
Now we can plot these metrics simply with a LineChart.
const widget LineChart(
    () => ({
        mineRate: granularity(metric, 5),
    }),
    {
        series: {
            mineRate: {
                label: 'Mine Rate',
                color: 'yellow',
            }
        }
    }
)
Conclusion
With these components in place, we can easily create a chart of our room’s energyAvailable levels. Spawning a new creep takes three ticks per body part; to ensure 100% uptime, the spawn and extensions would need to be filled before spawning is complete. Let’s approximate some goals.
The average cost of a body part is 160 energy, or 100 if we ignore the expensive claim parts. Each body part takes 3 ticks to spawn, so on average, we need to fill extensions at a rate of 33.3 energy/tick to achieve 100% spawn uptime. At level 7, we get two spawns, and at level 8 we have three, tripling that energy requirement.
This is more than a single room actually produces: at peak efficiency, two sources can produce 20 energy per tick. We can maintain a higher spawn rate with remote mining, or in bursts with storage. In the next installment, we’ll look at the what it will take to achieve a 100% spawn rate.
- Screeps #1: The Game Plan
- Screeps #2: Task Management
- Screeps #3: Data-Driven Development
- Screeps #4: Pipeline Optimization
- Screeps #5: Refactoring for Remote Mining
- Screeps #6: Remote Mining Hurdles
- Screeps #7: Damage Report
- Screeps #8: Logistics Overhaul
- Screeps #9: Streamlining Serialization
- Screeps #10: Questioning Everything
- Screeps #11: Moving Forward
- Screeps #12: Strategic Directives
- Screeps #13: World State
- Screeps #14: Decision Making
- Screeps #15: Room Planning
- Screeps #16: A Caching Diversion
- Screeps #17: Reports and Metrics
- Screeps #18: Spawn Uptime
- Screeps #19: Expanding Operations
- Screeps #20: The Great Purge
- Screeps #21: Patrolling the Perimeter
- Screeps #22: For Science
- Screeps #23: Botarena!
- Screeps #24: Boosting to the Moon
- Screeps #25: Arena
- Screeps #25: Arena - Pressing the Attack
- Screeps #25: Arena - Grouping Up
- Screeps #26: World - Discrete Objectives
Let me know what you think of this article on twitter @jonwinsley or leave a comment below!