The article below describes the AI in its current state: I'm still expanding and refining my codebase. Here's the GitHub repo if you'd like to follow along.
It's All About Data
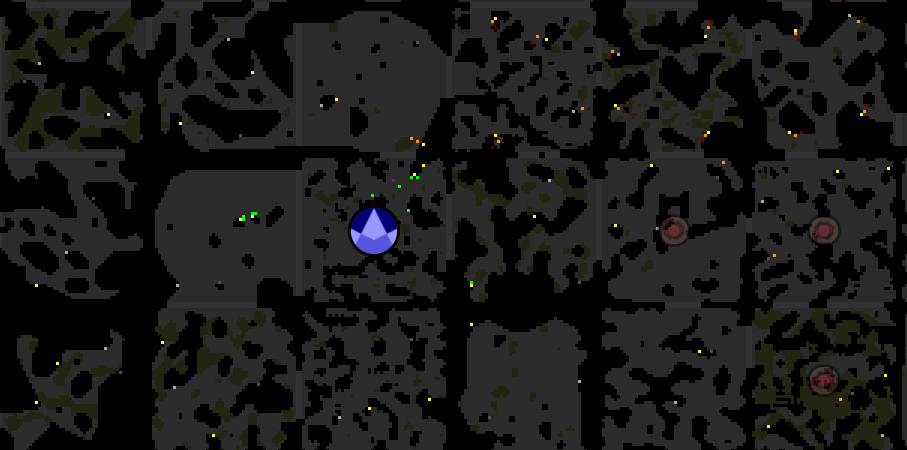
Creeps have successfully left the room and started mining! The Grey Company's view of the world has expanded beyond its borders. There are still some issues we need to tune, to make sure the energy is being carted where it needs to go and used effectively. But this poses a problem of its own: how can we see what the Grey Company sees?
I have some rudimentary reports in the console, which generate tables of data. For example, there's a general Office report that lists the status of each subsystem (OFFLINE, MINIMAL, NORMAL, or PRIORITY) and shows scan reports of surrounding territories. The TaskManager has a different report that lists reports, tasks, and idle minions.
Some of these I've set up with a global shortcut function that I can call from the console, as officeReport(). Others I have to navigate through the object hierarchy, as boardroom.offices.get('W8N3').managers.get('HRManager').report(). That's inconvenient and annoying.
I'd like to have a "heads up display" on the map with the most relevant data - perhaps several, to drill down to details of specific subsystems.
Heads Up Display
The first thing I'd like to see is the room planning layout. In our case, that translates to Franchises (set up at Sources) and Roads between the Spawn, Sources, and Controller. We can easily enough transform those roads into a poly line. I should also be able to switch the planning layout on and off.
Since our Architects are extensions of OfficeManager, they have the usual init/plan/run/cleanup phases. The architecture work (laying out construction sites) all happens in the plan phase, so we'll use the Run phase for visualization.
I'll create a global control object, we'll call it v, to switch things on and off:
export enum SwitchState {
    ON = 'ON',
    CONCISE = 'CONCISE',
    OFF = 'OFF',
}
export class Switch {
    state = SwitchState.OFF;
    on() { this.state = SwitchState.ON; }
    off() { this.state = SwitchState.OFF; }
    concise() { this.state = SwitchState.CONCISE; }
}
export class VisualizationController {
    roads = new Switch();
}

global.v = new VisualizationController()
Now, in our Architect run phase, we'll just check the state of that switch before rendering:
run() {
    if (global.v.roads.state === SwitchState.ON) {
        this.roads.forEach(road => {
            let rooms = road.path.reduce((rooms, pos) => (rooms.includes(pos.roomName) ? rooms : [...rooms, pos.roomName]), [] as string[])
            rooms.forEach(room => {
                // Technically this could cause weirdness if the road loops out of a room
                // and then back into it. If that happens, we'll just need to parse this
                // into segments a little more intelligently
                new RoomVisual(room).poly(road.path.filter(pos => pos.roomName === room), {lineStyle: 'dashed'});
            })
        })
    }
}
Now I can switch road planning visualizations with v.roads.on() and v.roads.off(). (I expect to use CONCISE for some other visualizations.)
We'll extend this principle for the other Architects. This doesn't save display settings between global resets, and eventually, to save CPU, we'll want to cache unchanged RoomVisuals with .export() and re-rendering only as needed. But for now, this is a fine step.
Next, let's display some diagnostics for our critical subsystems: Sales, HR, and Task Management. In this post, we'll just tackle Sales.
Sales
Important factors here are a) the Franchises we have set up (room, source level); how effectively they are being worked; and the amount of energy accumulated at each one. We'll track the following fields:
- Franchise (room, position)
- Salesmen (count/max harvesting positions)
- Effectiveness % (salesmen WORK parts / 5)
- Surplus
We can test this report in the console before we set up a visual of it:
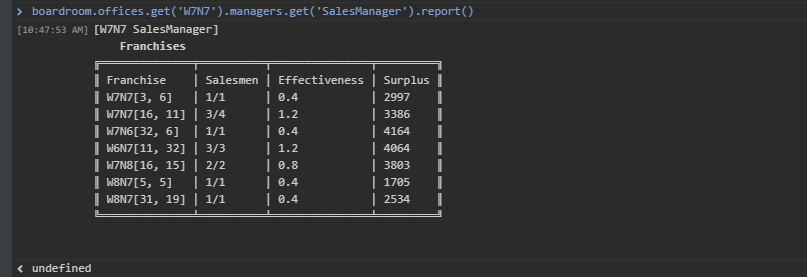
The information we need is all here. To display it as a RoomVisual, we'll need to generate a layout. After some testing, character width takes up approximately 40% of a unit, so we'll round up to 50% and estimate the width:
export const RoomVisualTable = (topLeft: RoomPosition, table: any[][]) => {
    if (table.length === 0) throw new Error('Expected at least one row')
    let headers = table.slice(0, 1)[0] as string[];
    let body = table.slice(1);
    if (headers.length === 0) throw new Error('Expected at least one column')

    // Calculate width of cells
    let columnOffsets: number[] = [];
    let columnWidths = headers.map((header, index) => {
        // Each character is approximately 40% the width of a grid square at default font size
        let width = Math.ceil(table.reduce((maxWidth, row) => Math.max(maxWidth, row[index].toString().length * 0.5), 0))
        columnOffsets.push((columnOffsets[index-1] || 0) + width);
        return width;
    })
    columnOffsets.unshift(0);

    let tableWidth = columnWidths.reduce((a, b) => a + b, 0);
    let tableHeight = table.length + 1 // plus the header row

    let vis = new RoomVisual(topLeft.roomName);
    // Draw table background
    vis.rect(topLeft.x, topLeft.y, tableWidth, tableHeight, {
        fill: 'rgba(0,0,0,0.3)',
        stroke: 'rgba(255,255,255,0.3)'
    });
    // Draw headers
    headers.forEach((header, index) => {
        vis.text(header, topLeft.x + 1 + columnOffsets[index], topLeft.y + 1, {align: 'left'});
    })
    // Draw body
    body.forEach((row, rowIndex) => {
        row.forEach((cell, columnIndex) => {
            vis.text(cell, topLeft.x + 1 + columnOffsets[columnIndex], topLeft.y + 2 + rowIndex, {align: 'left'});
        })
    })
}
We'll need to do a bit more work to get fully flexible styles, and there's a lot that can be improved about the display, but this is a good first step towards RoomVisual reports:
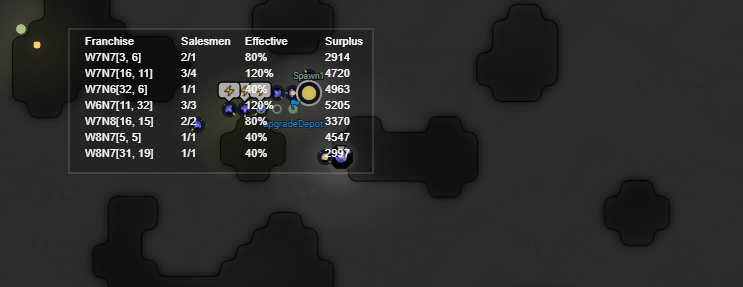
I already had console table reports for HR and Task Managers, so I just switched those over directly to the RoomVisualTable.
Future Improvements
After laying out some of the larger tables like HR and task management, I can see it'll be helpful to have different report views that I can switch between. The simple toggles above don't interact with each other, so I have to switch HR off before I switch Task on - otherwise the tables collide. We'll adapt the visualization controller to be a bit more flexible in this regard.
The Table generator itself has room for improvement: it can be distracting to have the entire table changing length when the content does, so it might make more sense to set the height directly and just let the content adjust itself. Styling, too, could be improved: there's no way to set a different style on headers.
Jakesboy2 from the Screeps Slack shared one of his visualizations which included a chart depicting room upgrade rate. I'd love to create a chart generator for the metrics we're tracking in the StatisticsAnalyst too.
Really, a lot of these visualization elements aren't unique to the Grey Company, so it might make sense to create an npm package to share these. If this is something you'd use, let me know!