Screeps #3: Data-Driven Development
The article below describes the AI in its current state: I’m still expanding and refining my codebase. Here’s the GitHub repo if you’d like to follow along.
Data and Analytics
The first step in getting to where you want to be is determining where you are. After implementing task management in the last post, I watched my minions moving around and could tell something wasn’t quite right. They were spending a lot of time moving energy around, but construction sites weren’t being built. I tried inspecting the memory, but staring at a raw JSON object is neither friendly nor helpful.
Reports
I needed better insight into what was going on. So I implemented a simple report:
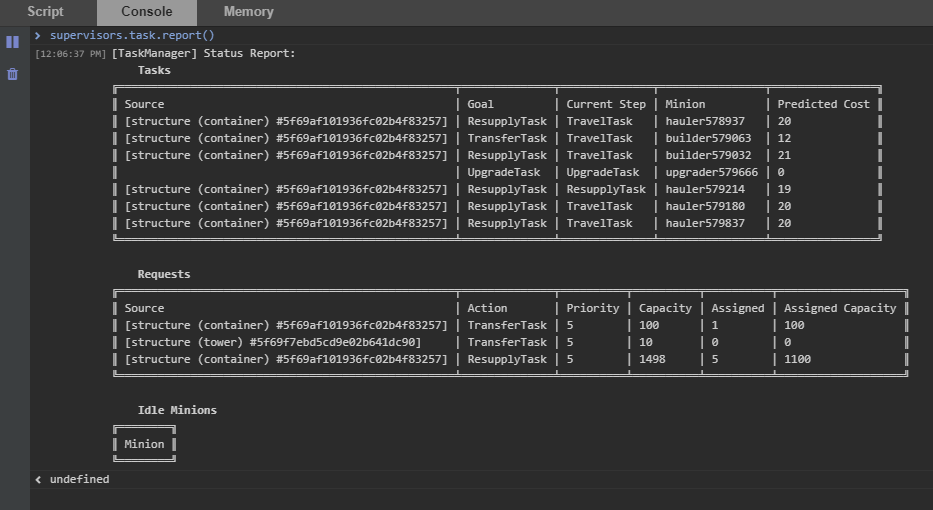
This is little more than a visual representation of the tasks and requests the TaskSupervisor is tracking internally, but it was immensely helpful. After watching the report for a little while, I realized a few things:
- Priority was being ignored - lower-priority requests were being assigned when higher-priority ones had not been fulfilled.
- Certain TaskActions were getting “de facto” priority by being sorted higher in the list
- Tasks were not being assigned to “favored” minions, e.g. builders kept getting distracted with hauling
I created priority “buckets,” assigning priority 10 requests first, then priority 9 requests, etc. This makes sure that no lower-priority tasks are assigned until the higher-priority requests are met (they do not need to be finished - just have enough minions assigned to meet capacity). I reduced the number of BuildTask requests, prioritizing one construction site at a time.
Then I gave minions “favored tasks” so that builders will prefer BuildTasks, upgraders will prefer UpgradeTasks, etc. I’m not settled on this, however; this seems like a step back from calculating which minion is actually best for the task. Builders and Upgraders have the same creep build, right now, so they should be interchangeable.
We need some better long-term data to track the lifecycle of requests, and maybe begin charting our energy pipeline. For this, I turned to screeps-grafana.
Dashboards
The screeps-grafana repo has a Docker setup to launch a Grafana instance, connect to the Screeps API, and pull down statistics from your running branch on the MMO. I ran into a couple hurdles getting it set up.
I signed up for Screeps via Steam, and logged in that way too, but the config file for screeps-grafana asks for a Screeps username and password. I went into my account on the website and discovered that I can set a password there: problem solved.
Now that the config file was created, I tried to launch the docker containers, but Grafana threw an error trying to bind to port 1337! After trying a few times, it occurred to me to check if something else was using the port. Sure enough, Razer’s control software was already using it, and when I changed the port in docker-compose I was able to launch Grafana properly.
Well, almost; Grafana worked, but I wasn’t getting any stats from Screeps. I stumbled around blindly for a bit before discovering that the stats were under a different query than in the sample dashboard. After I replaced screeps.* queries with stats.gauges.* queries in the sample dashboard source and re-loaded it, I had data!
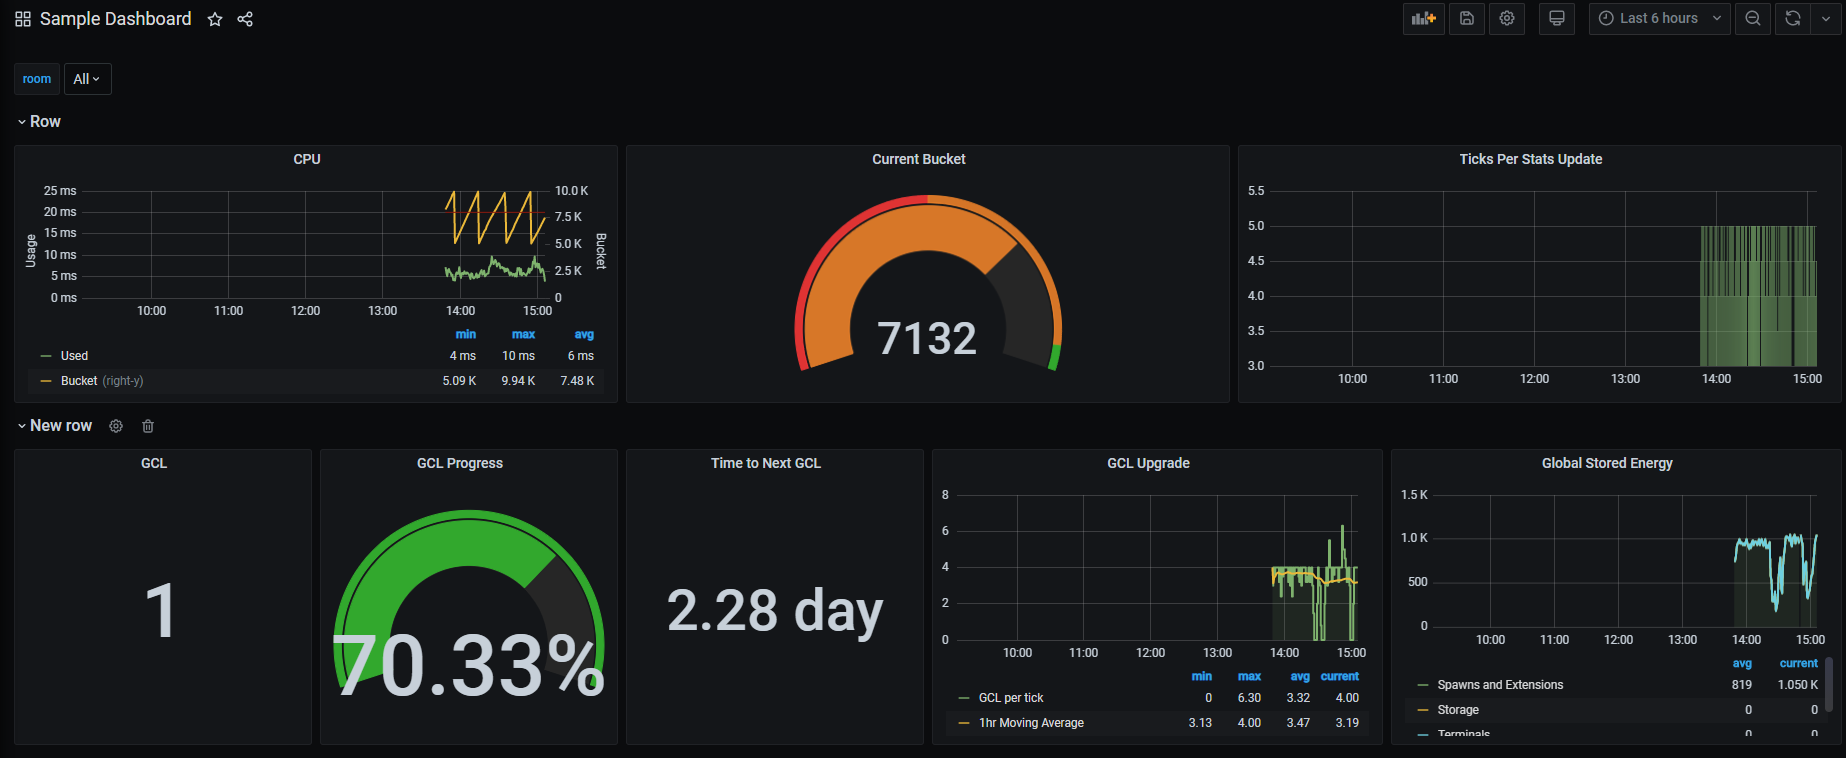
Now we just need to scrap the sample dashboard and decide what stats we actually want to monitor. Let’s start here:
- CPU - This is important, we need to make sure our task management isn’t going overboard.
- Task Management - Monitoring this will let us measure if we’re improving or not.
- Tasks in progress - The count of different kinds of tasks, average duration of each kind of task
- Requests in progress - Count of different kinds of requests, average number of minions assigned
- Energy Pipeline - Monitoring this will tell us what part of our pipeline needs to be optimized.
- Inputs - Source levels (harvesting rate vs. max harvesting rate), Mine Container levels.
- Outputs - Room Controller level (or really, rate of increase)
- Logistics - Output Container levels, build costs, repair costs, spawn costs, tower costs
We’ll see how useful this data is, and then adjust it as needed.
- Screeps #1: The Game Plan
- Screeps #2: Task Management
- Screeps #3: Data-Driven Development
- Screeps #4: Pipeline Optimization
- Screeps #5: Refactoring for Remote Mining
- Screeps #6: Remote Mining Hurdles
- Screeps #7: Damage Report
- Screeps #8: Logistics Overhaul
- Screeps #9: Streamlining Serialization
- Screeps #10: Questioning Everything
- Screeps #11: Moving Forward
- Screeps #12: Strategic Directives
- Screeps #13: World State
- Screeps #14: Decision Making
- Screeps #15: Room Planning
- Screeps #16: A Caching Diversion
- Screeps #17: Reports and Metrics
- Screeps #18: Spawn Uptime
- Screeps #19: Expanding Operations
- Screeps #20: The Great Purge
- Screeps #21: Patrolling the Perimeter
- Screeps #22: For Science
- Screeps #23: Botarena!
- Screeps #24: Boosting to the Moon
- Screeps #25: Arena
- Screeps #25: Arena - Pressing the Attack
- Screeps #25: Arena - Grouping Up
- Screeps #26: World - Discrete Objectives
Let me know what you think of this article on twitter @jonwinsley or leave a comment below!